
Every GenAI product now ships with a reporting dashboard. OpenAI User Analytics, Microsoft Copilot Dashboard, Google Gemini Reports, and Claude Team Analytics all promise visibility into how employees are using AI. But what they actually deliver is narrow and incomplete. Relying on network security tools to provide the visibility doesn’t work either; this approach provides visibility of how much traffic went to which URLs, but fails to provide true, prompt-level insights.
Today, Harmonic Security is announcing a suite of new reporting capabilities that enable security and AI governance teams to effectively report on AI use.
Problem 1: Missing Identity Context
Leadership’s top question is always: who is using these tools, and for what? Today’s dashboards can’t answer it. They report “active users” and “messages sent,” but without any tie to departments, roles, or regions. Finance and Engineering appear identical. A junior analyst and a senior VP both just count as “1 user.” This leaves executives blind to which teams are experimenting responsibly, which are mishandling sensitive data, and which leaders are driving adoption.
With Harmonic, you can easily report on trends from different employee departments, locations, and groups. You can even create your own custom employee groups. If you’re interested in understanding how different parts of your business are using AI, this is for you!

Blind to Shadow AI
Dashboards only measure sanctioned use: OpenAI reports on ChatGPT Enterprise, Copilot on Copilot, Gemini on Gemini, Claude on Claude. But employees regularly spin up free accounts, install browser extensions, or test new AI tools on their own.
None of that shows up in reporting, even though it often represents the greatest source of risk. The official numbers only capture the tip of the iceberg.
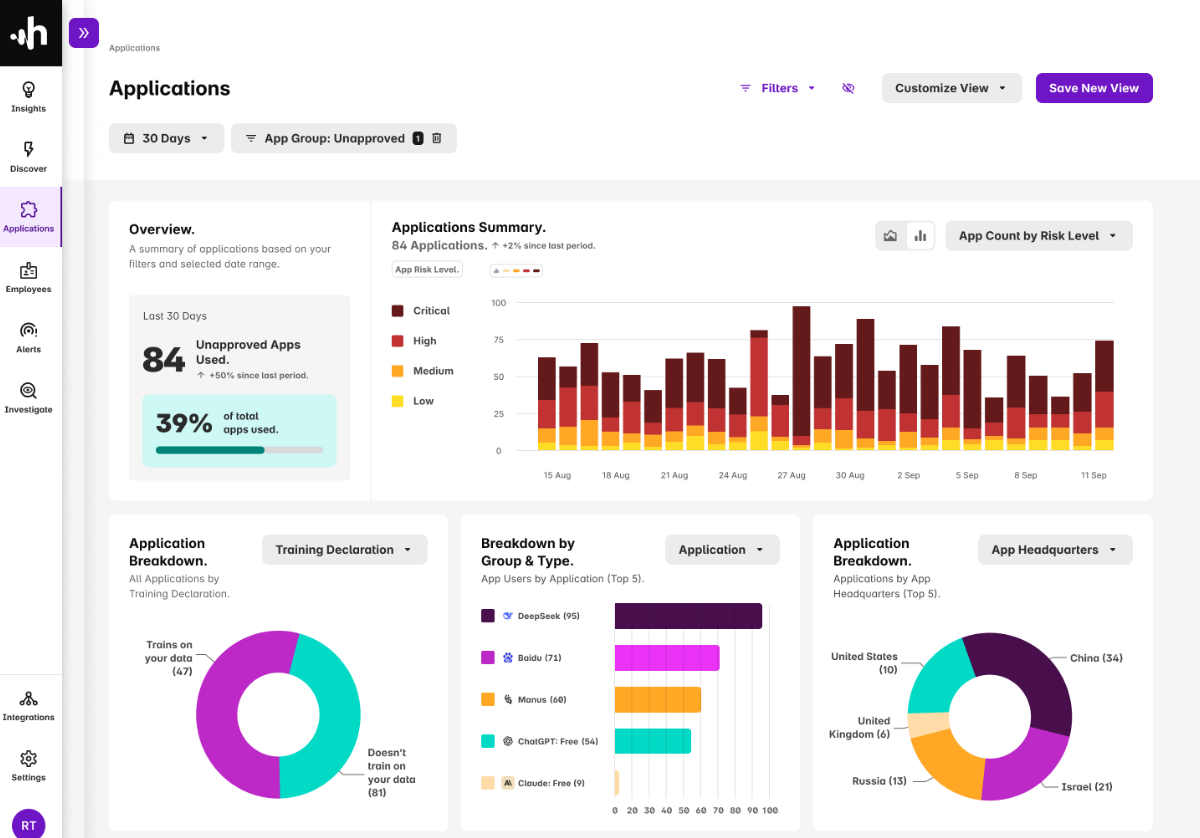
With Harmonic, you can report on all GenAI usage. This includes enterprise, free, and personal accounts of GenAI tools. It also extends to GenAI-enabled SaaS tools like Canva, Grammarly, and Gamma. Furthermore, you can create groups of applications to identify high risk use, such as tools located in China, or unapproved tools.
No View Into Data Sensitivity
Even the data these dashboards do provide is misleading. They count prompt volume, not risk. A trivial “write a haiku” request looks the same as pasting in an M&A contract. Ten thousand harmless queries seem more concerning than a single case of sensitive data leakage.
The result is metrics that invert the risk profile and fail to answer the questions boards and committees care about most: is confidential, regulated, or proprietary data leaving the building?
With Harmonic, you don’t just see how often employees access GenAI tools – you see the data itself. On top of that, our small language models classify sensitive data, so you can easily see what sensitive data went into which GenAI or GenAI-enabled tools.

Why It Matters for AI Governance Teams
With prior reporting, security teams found it impossible to tell the real story of AI use inside the business. Leaders didn’t know who is driving adoption, where sensitive data might be exposed, or how usage varies across teams. Instead of helping organizations govern GenAI, today’s dashboards highlight just how little visibility anyone truly has.
With Harmonic Security’s new reporting, you can easily a) tie usage back to identity and department b) cover sanctioned and unsanctioned tools and c) classify data sensitivity in prompts.
To learn more about our reporting, schedule time with our team here: harmonic.security/get-demo
.png)